CITYWIDE ANALYSIS: CITYWIDE SUMMARY

UPDATE: Through a series of regional meetings in April, we engaged with more than 500 members of our community around the Citywide Analysis and gathered over 300 feedback forms in which those attendees shared their insights, ideas, and questions as they relate to the Analysis.
At the link below, you can view a summary of this information, focusing on key takeaways from the Citywide Analysis and recurring themes in the stakeholder input. This information and feedback is being used to inform the set of recommendations being drafted for our K-8 schools that will be shared in the next round of regional meetings.
Key Metrics for Academic Quality
To assess the quality of Cleveland’s schools, we consider:
- School report card grades1.
- the trend of student performance over the last three years.
Academic Quality
- 26% of K-8 students, or more than 10,000 out of 38,000, attend an A, B or C-rated school.
- Access to better performing school options is higher for west side residents at the K-8 level.
- 19% of high school students, or roughly 2,800 of 14,000, attend an A, B or C-rated school.
- Access to better performing school options is higher for east side residents at the high school level.
Key Metrics for Enrollment and School Choice
To track where Cleveland students are choosing their schools, we look at:
- historical and forecast enrollment trends.
- attendance patterns across District, charter, and private schools.
Enrollment and School Choice
- By 2022-23, K-8 enrollment is forecast to decline 3.9%. Northeast and Near West are the regions with the largest declines, while the Southwest region is forecast to grow.
- 45% of K-8 students residing in Cleveland attend a charter or private school.
- By 2022-23, high school enrollment is forecast to increase 0.7%. The West and Southwest are the regions with the largest growth, while the Northeast is forecast to decline in enrollment.
- 43% of high school students residing in Cleveland attend a charter or private school.
Key Metrics for Building Use and Condition
To assess the use and condition of school buildings in Cleveland, we consider:
- the proportion of the school building that is being used by students, including spaces used for special populations and PreK services.
- the condition of the school building.
Building Use and Condition
- There are 8,000 excess District K-8 seats, which represents about 25% of seats. Nearly half of empty seats are in schools rated A, B or C.
- Reported charter capacity points to more than 3,000 additional empty K-8 seats.
- 65% of District K-8 enrollment is in buildings constructed or renovated since 2002.
- There are 9,000 excess District high school seats, which means roughly 40% of building space currently in operation today is unused.
- Approximately 57% of students enrolled in District high schools are served in buildings that have been newly constructed or renovated since 2002.
Key Metrics for Program Viability
To measure which schools have enrollment to support a sustainable and vibrant teaching and learning environment, we measure:
- financial sustainability of District schools based on enrollment thresholds2.
Program Viability
- For District K-8 programs, 51% are below the minimum enrollment target of 360 students and 78% are below the desired enrollment level of 450 students.
- Two-thirds of schools below the minimum target are located in regions that are forecast to have declining enrollment, suggesting those schools will continue to struggle to achieve viable enrollment levels.
- 79% of District high school programs are below the minimum viable target of 400 students. 95% of District high school programs are below the desired enrollment level of 500 students.
- Half of the programs below the minimum viable enrollment target are located in regions that are forecast to have declining enrollment, suggesting those schools will continue to struggle to achieve viable enrollment levels.
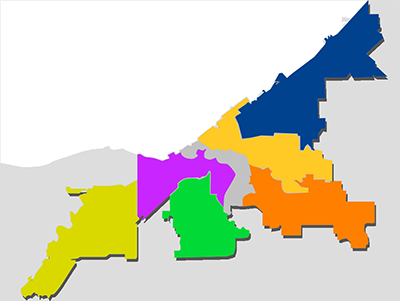
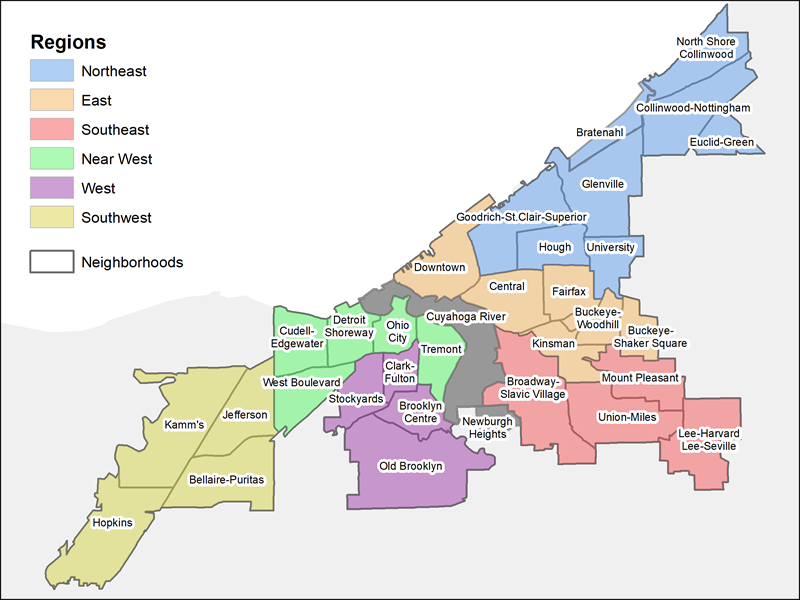
Find Your Region
Click on your region to see more detailed information on each metric.
