
-
Attendance

In 2015, the Cleveland Metropolitan School District launched a community-wide campaign to change attitudes about attendance.
The schools were improving under The Cleveland Plan, a customized blueprint for education reform in the city, but the District, like others across the country, suffered from chronic absenteeism.
Students can’t learn if they are not in class.
District data supported the case: Students who missed more than 10 days in a year – just one day per month – scored an average of 12 points lower on state reading tests and 15 points lower on math tests. They were 9 percent less likely to meet Ohio’s Third Grade Reading Guarantee and earn promotion to fourth grade. High school students were 34 percent less likely to graduate.
The “Get 2 School. You Can Make It!” campaign drove home the message with billboards and yard signs. Community partners, led by the Cleveland Browns Foundation, showed their support.

-

CMSD Tackles Attendance
09/15/23 -- CMSD schools continue to find creative and effective ways to tackle chronic absenteeism.
-

Browns, Arby's reward students for attendance (Video)
12/22/2021 -- Before CMSD began its winter break, students at several schools received special treats. Some saw a performance of selections from "The Nutcracker." Others received lunch from Arby's.
-
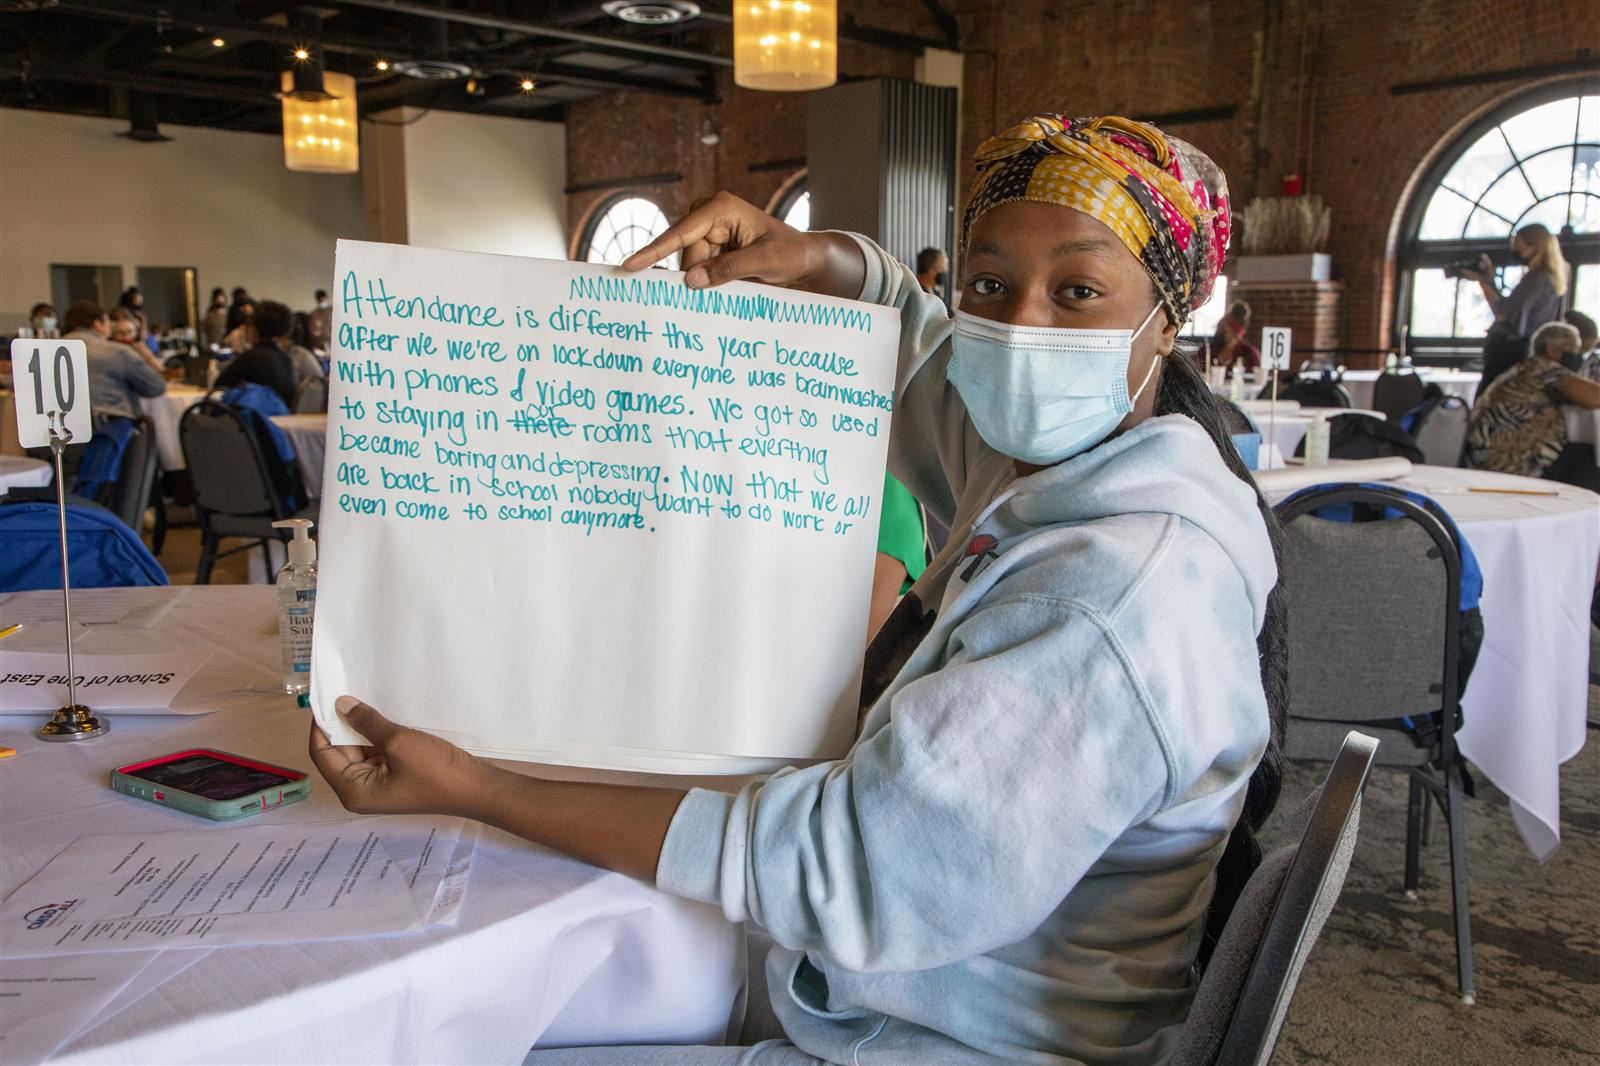
Student committee tackles attendance, vaccination hesitancy
10/12/2021 -- Due to COVID-19 restrictions at Windows on the River, only 132 students from his Student Advisory Committee attended, instead of the usual 420, but the power of their voice was just as strong.